

To access the dashboard in a space, navigate to “Dashboards” in the sidebar, then choose your project from the dropdown at the top of the page.
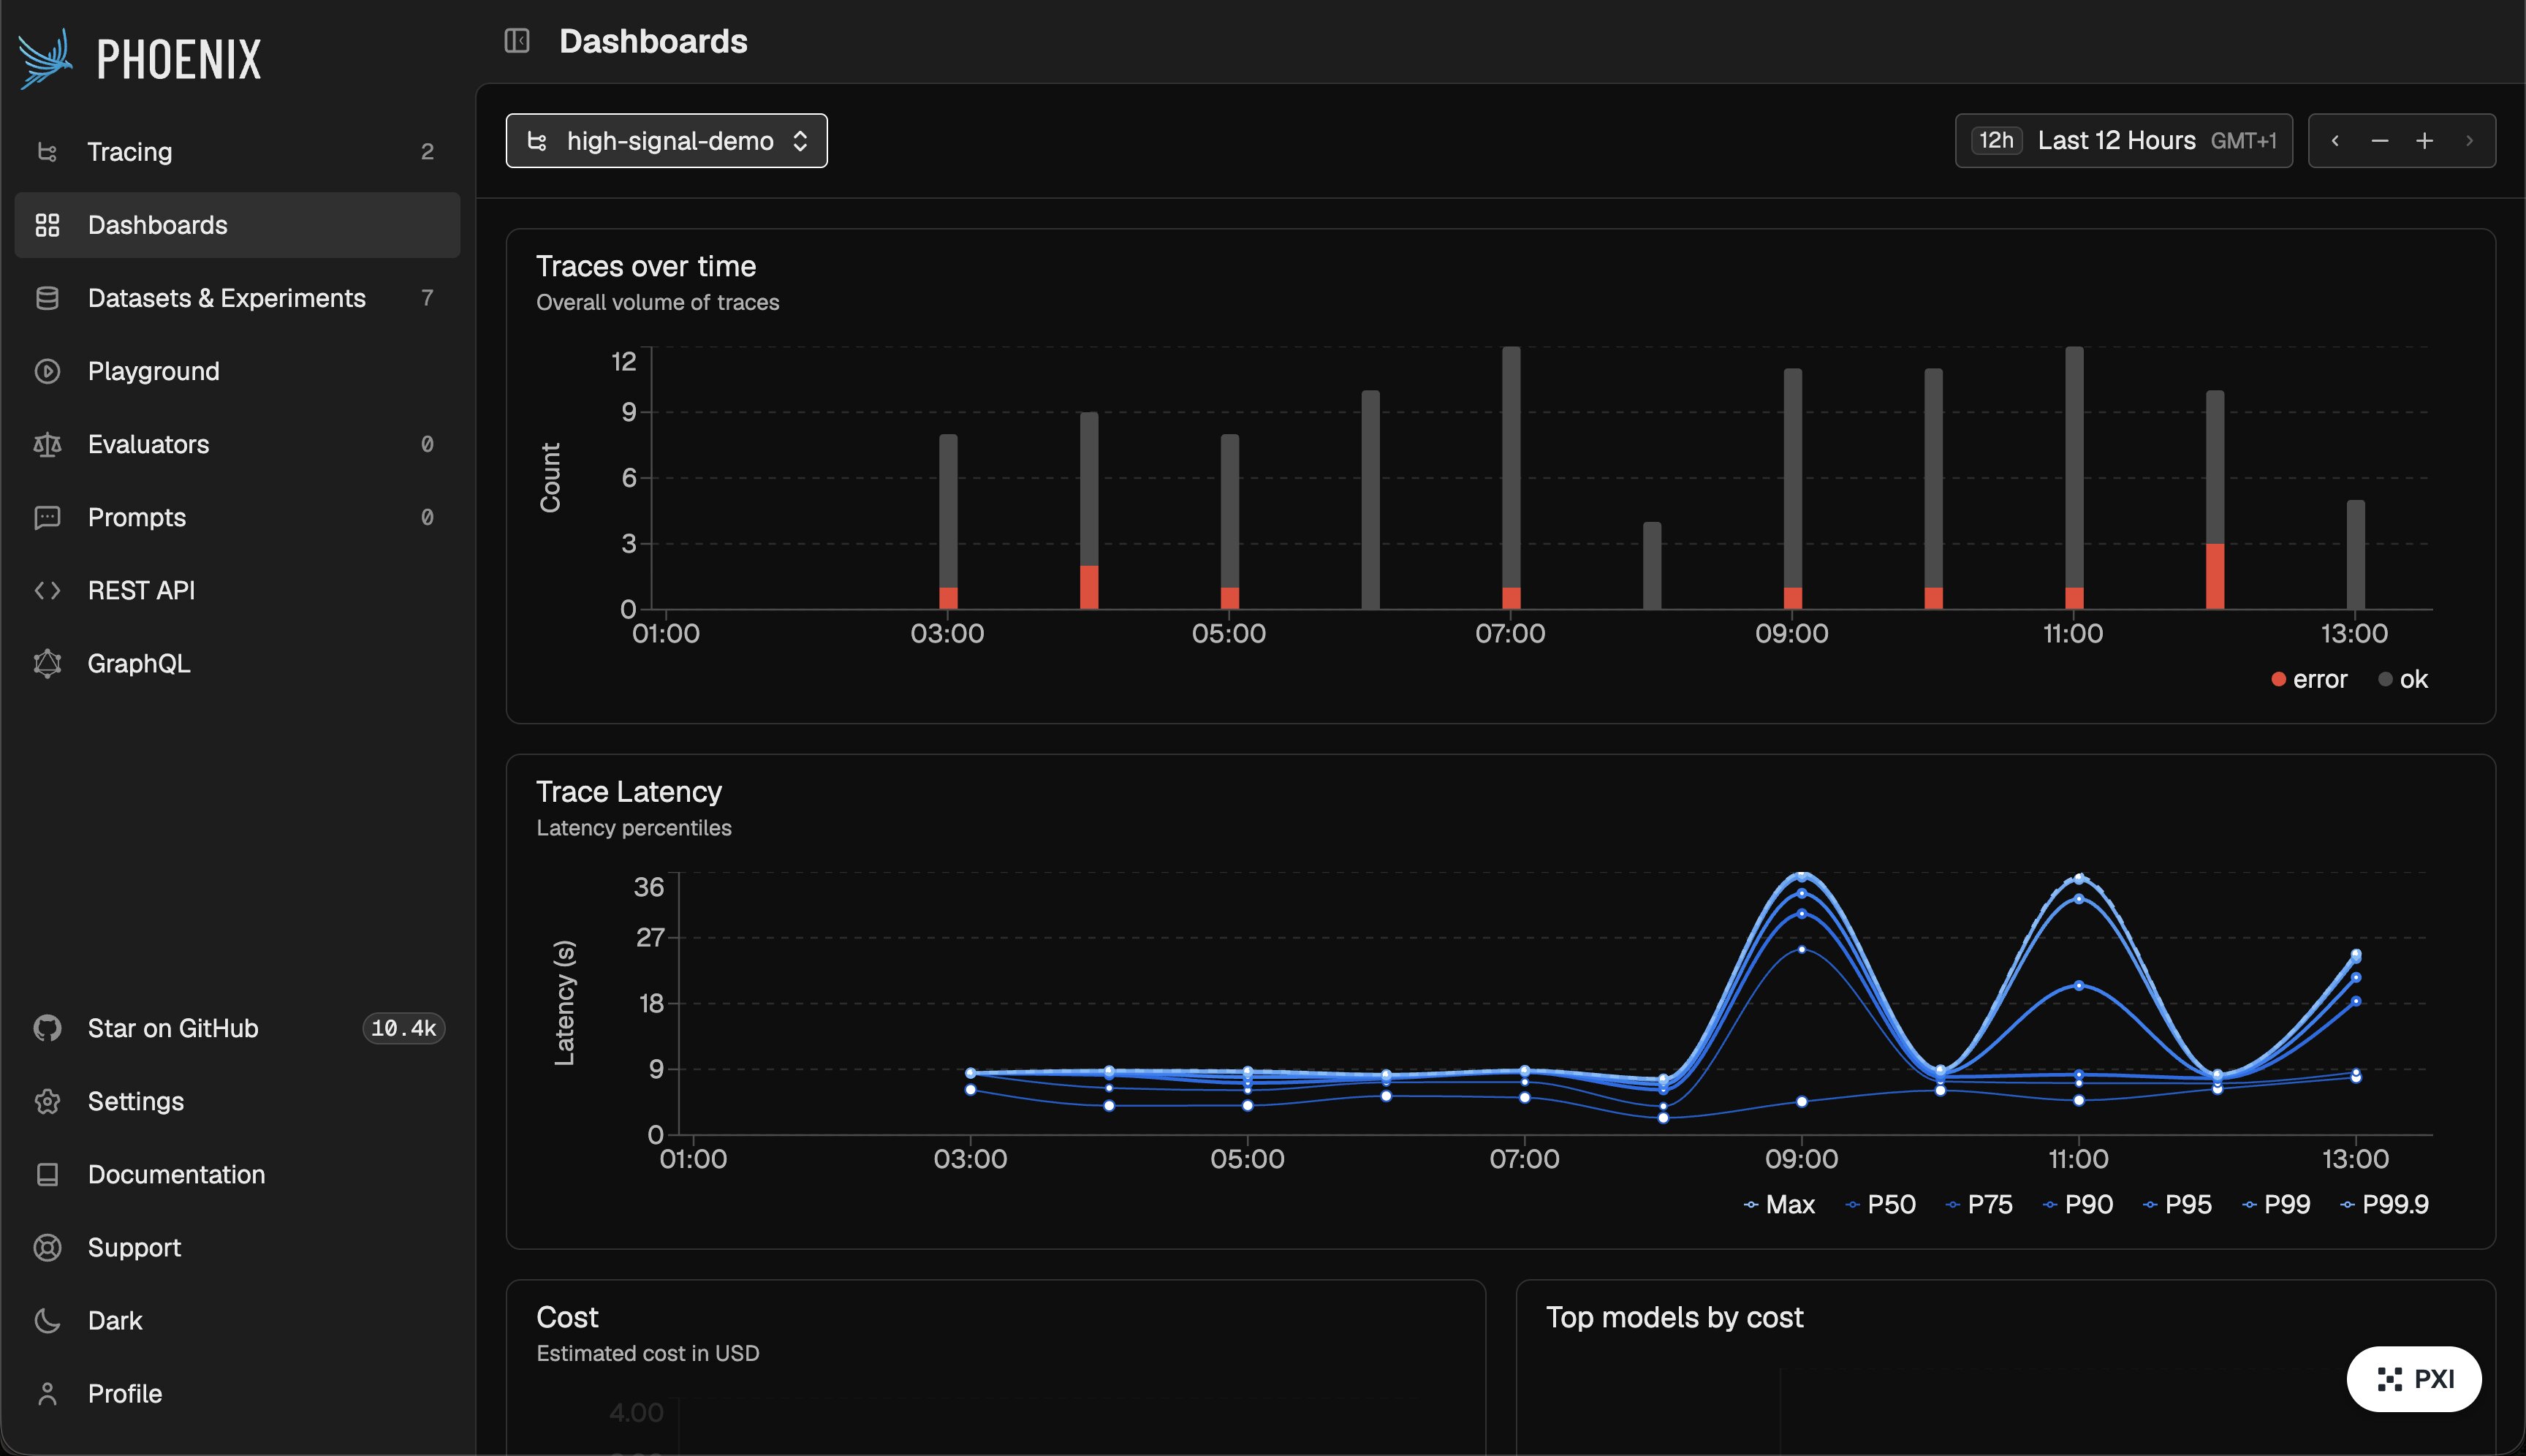
Traces that are sent to a project are automatically indexed for metrics. This lets you quickly identify areas of poor performance. Each dashboard by default includes:
- Traces over time
- Trace Latency percentiles
- Cost estimated in USD
- Top models by cost
- Top models by tokens
- Token usage by prompt and completion
- Prompt token details by input, cache, and audio parts
- Completion token details including output, reasoning, and audio parts
- LLM span counts over time
- LLM spans with errors over time
- Tool span counts over time
- Tool spans with errors over time
- Average Span annotation scores
- Average trace annotation scores
- Average session annotation scores
Info
If you need custom alerting and dashboards on top of your trace data, including metrics tailored for non-developer stakeholders, Arize AX’s Dashboards supports these additional features.