

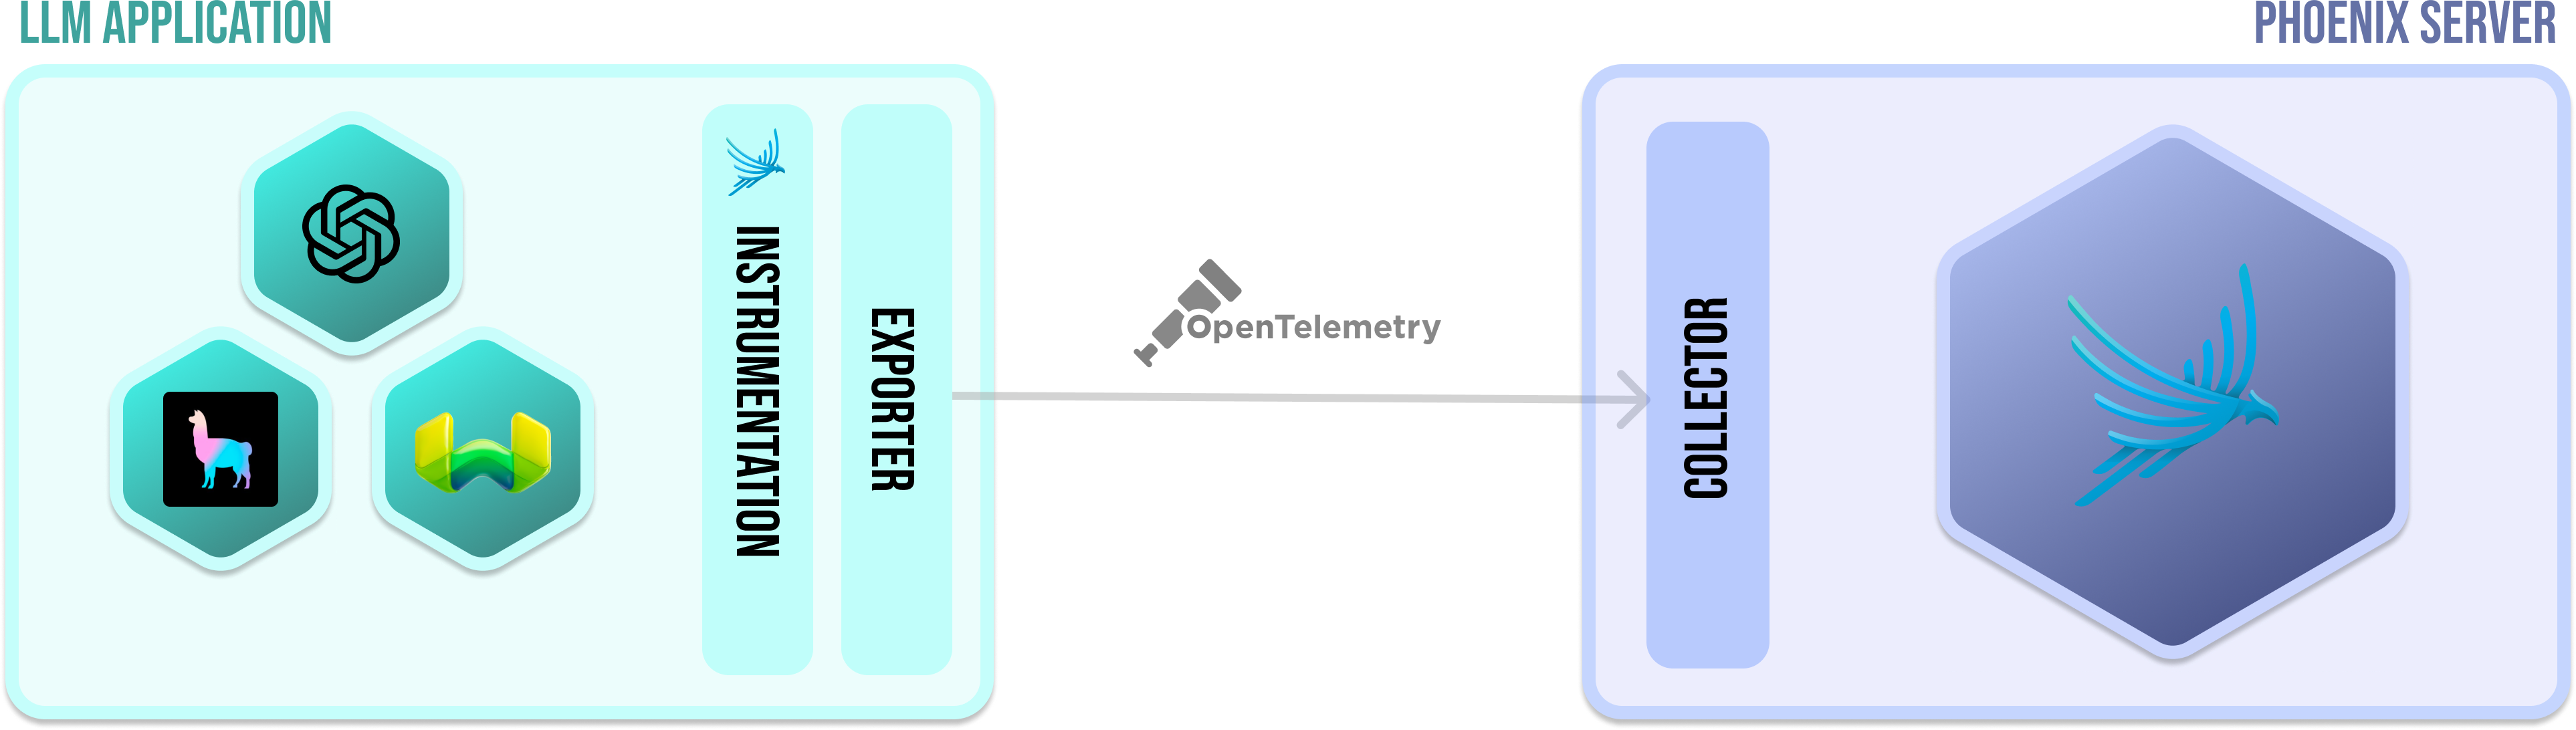
Instrumentation#
In order for an application to emit traces for analysis, the application must be instrumented. Your application can be manually instrumented or be automatically instrumented.
With phoenix, there a set of plugins (instrumentors) that can be added to your application’s startup process that perform auto-instrumentation. These plugins collect spans for your application and export them for collection and visualization. For phoenix, all the instrumentors are managed via a single repository called OpenInference. The comprehensive list of instrumentors can be found in the how-to guide.
Exporter#
An exporter takes the spans created via instrumentation and exports them to a collector. In simple terms, it just sends the data to the Phoenix. When using Phoenix, most of this is completely done under the hood when you call instrument on an instrumentor.
Collector#
The Phoenix server is a collector and a UI that helps you troubleshoot your application in real time. When you run or run phoenix (e.x. px.launch_app(), container), Phoenix starts receiving spans from any application(s) that is exporting spans to it.
OpenTelemetry Protocol#
OpenTelemetry Protocol (or OTLP for short) is the means by which traces arrive from your application to the Phoenix collector. Phoenix currently supports OTLP over HTTP.